

Accumulation members
For Employers using SAFF, the address details changes will automatically flow through to Vision Super via their file.
DB Members and ad-hoc address updates for Accumulation members
Employers can update an address for a member anytime via the Employer Online portal. Go to Member Maintenance > Search for and select the member > Click Edit and the follow the prompts.
Accumulation members
For Employers using SAFF, the Termination details will automatically flow through to Vision Super via their file.
DB Members and ad-hoc Terminations for Accumulation members
Employers can process a Termination for a member anytime either by submitting Form 19 which you can find on the website under resources or via the Employer Online portal. Just following the path Member Maintenance > Search for and select the member > Click Terminate and the follow the prompts.
Please send an email to [email protected] detailing your request or call the Employer Hotline on 1300 304 947
We do not currently charge a fee to use our Clearinghouse solution, but per the Clearinghouse agreement we do reserve the right to change this at any time.
You can reset your password by visiting the Employer login page and clicking the Forgotten your password link.
If you have any issues with resetting your password, please call the Employer Hotline on 1300 304 947.
If you call us on 1300 304 947 we can arrange for booklets and PDS to be delivered as well as our induction video that’s available for new employees.
No, there are no costs involved.
You can claim certain deductions on contributions made to complying super funds on behalf of employees under the age of 75.
For employees over 75, you may only claim a deduction if an industrial award, determination or state award agreement requires a contribution.
There are rules and exclusions that apply so make sure you’re familiar with the information provided on the ATO’s website.
When an employee is 18 or over you must pay them superannuation guarantee (SG) which is 11.5% of their Ordinary Time Earnings, to super. If the employee is under 18, they must also work for more than 30 hours per week to qualify for SG. Exceptions apply. Please refer to the ATO website for more information.
If you change your employer in most instances you can request, they pay your super into your Vision Super account. Simply fill in the Choice of Fund form and hand it in to your payroll officer.
If you have to go with your employers default super fund you may be able to keep your insurance benefits with us because your insurance cover with Vision Super doesn’t necessarily cease when you change employers (provided that you satisfy the terms and conditions contained within the relevant insurance policy).
We’d encourage you to talk to us before you engage a lawyer. Vision Super pays more than 85% of insurance claims, so the likelihood is your claim will be paid if you work with us directly, and you’ll end up with more of your money. Many lawyers advertise that they’ll work for you on a ‘no win, no fee’ basis, but if your claim is approved, they may take a large chunk of your payout – it can be around 30% of an entitlement. Our insurance team is here to help you through every step of the claims process, including all the paperwork, without having to get a lawyer involved and potentially losing money you need to pay for medical treatment or maintain your lifestyle.
Call us on 1300 300 820 and we will answer any questions and send you the required information.
Yes, you can cancel your cover at any time. Any cancellation or reduction of cover will take effect from the date we receive your request or the date you specified in your request (as long as it’s after the date we receive it). If you are replacing your existing cover with an alternative cover, before cancelling we recommend that you have your replacement cover in place first. To talk to us about cancelling a policy, please call us on 1300 300 820.
If you are thinking about changing your insurance please consider seeking financial advice before making any changes to make sure it is right for you and your needs and circumstances.
You may be able to get cover if you have a pre-existing medical condition. You will just need to apply to remove the pre-existing condition exclusion when you join by filling in a Personal Statement. Our Insurer will review your application taking into consideration any pre-existing conditions and general health and advise if your request has been accepted.
If your application is unsuccessful, there will be a two-year Pre-Existing Condition (PEC) exclusion on Death and TPD cover and Income Protection cover. This means that no benefit will be paid if you are totally and permanently disabled, terminally ill or die as a direct or indirect result of a pre-existing medical condition in the first two years of your insurance cover.
You can have multiple income protection policies, and there are legitimate reasons why people choose more than one product.
However, some income protection policies prevent claimants from receiving more than a certain percentage of their gross salary while off work. What that means is you could have three income protection policies that all offer payments equalling 75 per cent of your gross salary, but you wouldn’t be able to claim the full amount from all three. You would typically be limited to a combined maximum of 75 per cent across the policies.
Yes. You can have more than one death, or death and TPD policy in addition to the one you hold in your Vision Super account. However, depending on your circumstances rather than managing multiple policies it might be as simple as increasing the cover you have with us without the need for further medical assessments. It is generally more cost-effective to have one policy so that you are not paying premiums on more than one policy.
Increases in cover in Vision Super may require a medical assessment. If you are considering cancelling cover you hold outside of Vision Super and replacing it with cover in Vision Super, we recommend you call us first on 1300 300 820. Please consider seeking financial advice before making any changes to make sure your insurance is right for you and your needs and circumstances.
We’re required to have Target Market Determinations under the Treasury Laws Amendment (Design and Distribution Obligations and Product Intervention Powers) Act 2019.
This is to make sure we’re keeping members at the centre of our approach to the design and distribution of our financial products.
This legislation requires financial services product issuers to design products that are appropriate for the consumers in the target market and consistent with their objectives, financial situation, and needs.
A Target Market Determination is a document which describes who a product is appropriate for (target market), and any conditions around how the product can be distributed to customers.
It also describes the events or circumstances where we may need to review the Target Market Determination for a financial product.
Cash investment options are generally invested in money market securities, such as bank term deposits and negotiable certificates of deposit.
If you are risk averse or have a short timeframe, then a Cash option that typically provides stable, low risk returns may be suitable for you. This type of investment option can protect the nominal value of your superannuation, but the returns will often be low compared with other investment options over the medium to longer term.
Cash can be a safe haven in times of economic uncertainty, and occasionally you may wish to aim to preserve capital by allocating some of your super to cash.
We recommend that you obtain financial advice before making any decisions about investing in our Cash option.
To book an appointment with a Vision Super financial planner, either call us or complete our online appointment form:
Go to the form to book an appointment online >
Call our Contact Centre on 1300 300 820 (Monday to Friday 8:30am to 6pm).
Advice fees may apply, which will be discussed with you before any work is undertaken.
We recommend that you obtain financial advice before making any decisions about switching between investment options. To book an appointment with a Vision Super financial planner, either call us or complete our online appointment form:
Go to the form to book an appointment online >
Call our Contact Centre on 1300 300 820 (Monday to Friday 8:30am to 6pm).
Advice fees may apply, which will be discussed with you before any work is undertaken. For full details on advice costs, please refer to the Vision Super Fees and Costs guide.
Decisions about which investment option is most appropriate for you should be based on a considered assessment of your risk profile. Occasionally you may wish to review your risk profile. For example, when you are first starting out in the workforce or when you are a few years away from retirement and/or going into retirement.
Frequent switching between investment options and trying to second-guess the market can be risky, particularly for high-risk investment options designed to be held in the long-term (6 or more years). You should switch only after a thorough review of your long-term investment strategy.
Implementing Switches
You can switch investment options for some, or all, of your account balance, future contributions, or both. You can also nominate which investment option you would like your withdrawals to be made from. Vision Super does not charge members for switching their investment options.
You can switch between investment options by logging into our website, or the Vision Super app, or by sending us a completed Investment choice form. You can also call us, on 1300 300 820 (Monday to Friday 8:30am to 6pm).
Investment switches are processed based on the unit prices of the relevant investment options declared on the next business day after we receive your switching request, unless there is a delay with processing due to abnormal market conditions or system failure.
Growth assets such as Australian shares are higher risk and typically offer a higher potential return compared to defensive assets such as cash. They aim to grow the capital that’s invested and provide some income. Defensive assets are lower-risk investments which aim to protect the capital invested while providing a high proportion of return as income.
The classification of assets into either growth or defensive provides a rough indication of the risk of an asset. However, it has shortcomings as it:
Our primary objective is to maximise our members’ investment returns so that our members have more for their retirement. Vision Super’s approach to responsible investing is actioned through our proxy voting, collaborative initiatives, company engagement, carbon budget, security exclusions and through policy advocacy work through our proxy research advisers and on occasions directly when required.
One of the means by which we try to achieve this objective is to instruct our underlying investment managers to incorporate Environmental, Social and Governance (ESG) considerations into their investment decision-making processes. We believe that this approach will help support long-term investment performance and enhance risk management.
The way we factor ESG issues into our investment decisions is set out in our Responsible Investment Policy.
We are a signatory and member of a range of organisations that promote responsible investing in the superannuation industry, including the Principles for Responsible Investment (PRI) and the Australian Council of Superannuation Investors (ACSI). We are also a signatory to the Global Investor Statement to Governments on the Climate Crisis and we are a lead and support investor to the Climate Action 100+ initiative. This is an investor-led initiative aiming to ensure the world’s largest corporate greenhouse gas emitters take appropriate action in relation to climate change.
In our PDS we disclose “Investment fees and costs” and “Transaction costs” that include investment expenses relating to the investment management of Vision Super’s assets.
Investment fees and costs include investment expenses relating to the investment management of Vision Super’s assets, such as base and (in very few cases) performance-related fees paid to investment managers and advisers, management fees charged in investment vehicles, asset consulting fees, bank fees, custodian fees and internal Vision Super costs related to the management of the Fund’s assets.
Transaction costs include explicit transaction costs incurred by investment managers such as brokerage, settlement costs and stamp duty, as well as buy sell spreads charged by our investment managers or in underlying investment vehicles.
Investment and transaction fees and costs are not deducted directly from your account. Investment and transaction fees and costs are indirect fees that are deducted from the investment option unit prices and are therefore reflected in the returns allocated to your account through changes in the unit prices.
Premixed options are made up of multiple asset classes, like shares, property, cash and bonds, while the single sector options are made up of a single asset class. This means the premixed options are more diversified than the single sector options.
Diversification is a method of reducing investment risk as different asset classes tend to perform differently. It means spreading your investments both across and within multiple asset classes. The principle is that the more you diversify your portfolio, the more your risk is mitigated against a single asset performing badly. With adequate diversification, a single asset performing poorly will not result in your whole return being poor or negative.
However, it’s important to understand that all investments have some level of risk, and you can never diversify away market risk, which is risk that affects the whole market.
Our premixed options provide a degree of diversification across asset classes and the underlying investments.
By their nature, single sector options are not diversified across different asset sectors but do employ diversification through the underlying investments. The Innovation and Disruption option is the least diversified of our investment options because its focus is on a small number of companies that use technology in an innovative way or disrupt their industry.
You can invest in one or more of our premixed options, each with asset allocations determined by us. Or if it suits your investment plan, you can also choose your own asset allocations using our single sector investment options or invest in a combination of premixed and/or single sector investment options.
For more information about the risks of investing in superannuation, you can read the Vision Super Product Disclosure Statement for each product.
The latest monthly investment returns for the Vision Super investment options are available here >
Returns may go up and down, so past returns are no indication of future performance.
Risk tolerance is a key factor when determining the appropriate investment option or options for you. Risk tolerance often changes as we progress through life.
The best way to work out your risk profile is to have a discussion with one of our financial advisers. They will take you through a questionnaire that will help determine what amount of your money should be allocated to growth (higher risk) investments such as shares and property, and what amount should be allocated to defensive (lower risk) investments, like cash and fixed interest. They will then discuss your investment options and provide you with a set of recommendations.
To book an appointment with a Vision Super financial planner, either call us or complete our online appointment form:
Go to the form to book an appointment online >
Call our Contact Centre on 1300 300 820 (Monday to Friday 8:30am to 6pm).
Advice fees may apply, which will be discussed with you before any work is undertaken. For full details on advice costs, please refer to the Vision Super Fees and Costs guide.
These items reflect short-term liabilities such as overdrafts and margins that need to be posted to collateral accounts for strategies using exchange traded derivatives following certain market moves.
Our Australian equities managers invest in portfolios of predominantly Australian companies. This may well include companies that are property or infrastructure businesses, which are classified as Listed Property or Listed Infrastructure in the portfolio holdings reporting. Similarly, the cash holdings within these portfolios will be reported as Cash.
The rules the government has put in place for super funds are designed to provide greater transparency about underlying investments and place increased focus on trustees ensuring their only consideration, when investing, is to act in the best financial interests of our members.
We take the environmental, social and governance (ESG) performance of companies into account because we believe that companies that perform well on these factors are more likely to have better long-term performance. More detail on the way we factor responsible investment considerations into our decision-making, including our overarching investment beliefs and divestments framework, is set out in our Responsible Investment Policy.
However, if we excluded every company that someone ‘might not like’ from our portfolio, we would have an increasingly narrow field of possible investments. People have a wide range of views on companies they believe we shouldn’t invest in – this list would cover everything from dairy companies, to fashion brands, medical research, gaming and banks.
Restricting our investments like this would almost certainly reduce diversification and impact on portfolio performance over the longer term – which runs counter to our core obligation to act in the best financial interests of our members.
Vision Super excludes companies that are identified by our ESG data service provider as having any involvement in the production of tobacco. Alternative smoking products (including vaping) companies are also excluded.
Our decision to divest from tobacco producers also reflects the risk that the returns from these companies will be adversely impacted by litigation and/or regulation.
Links to the list of equity securities that we consider to be excluded investments as well as the related definitions are provided below:
A link to the Responsible Investment policy is provided below:
Controversial weapons are weapons that can have a severe impact on civilians and are generally banned under international treaties. Land mines, cluster bombs and nuclear weapons are deemed to be particularly controversial because of their indiscriminate impacts on civilians and the disproportionate harm they cause – in the case of land mines, for many years after a conflict has ended. Despite being widely considered to be controversial and often prohibited by international treaties, these weapons are still produced in some parts of the world.
Based on information provided by our ESG data service provider, Vision Super excludes listed equity investments that generate:
Links to the list of equity securities that we consider to be excluded investments as well as the related definitions are provided below:
A link to the Responsible Investment policy is provided below:
Our exposure to fossil fuels is implemented through carbon intensity restrictions for our listed equity portfolios. The listed equity asset classes are managed with an approach that aims to provide meaningfully less carbon-intensive exposure versus the respective benchmarks (calculated on MSCI Analytics on scope 1 and 2 carbon intensity levels). Our listed equity carbon intensity restrictions apply to our direct equity investments across our options. From time to time, it will be necessary for our investment managers to transition the portfolios they manage for the agreed Excluded Securities List (ESL), for example where a portfolio has been transferred into Vision Super as part of a merger, or where there is a material change in our approach to exclusions.
For further information please refer to our Carbon Budget page
Our exposure to fossil fuels is implemented through carbon intensity restrictions for our directly held listed equity portfolios. For further information please refer to our Carbon Budget page
You can find detailed information about our investment exclusions related to tobacco and alternative smoking products (including vaping), and controversial weapons and nuclear weapons on our Listed equity security exclusions page.
The exposure to China can vary significantly across the range of investment options. Generally, investment options with a higher allocation to shares have more direct exposure to China. At the asset class level, the direct exposure to China tends to be in International equities, Global fixed interest and Alternative debt. The investment options also have indirect exposure to China, as it is the second largest economy in the world and Australia’s largest trading partner. What happens in China matters for the global economy and asset markets. Most of the investment options have exposure to companies where Chinese consumers or businesses are major customers or suppliers, for example, global companies like Apple, Nike and Boeing, as well as resource companies such as BHP and Rio Tinto.
The government requires Australian superannuation funds to publish information about the investments they hold in each investment option on behalf of members. Our portfolio holdings reporting for each investment option allows you to see what your money is invested in, across a range of asset classes as defined by the legislation and derivatives.
Centrelink needs to know some details so they can calculate payments such as the age pension. We provide this information directly to Centrelink electronically, on your behalf, every February and August. You can request a Centrelink schedule from Vision Super at any time.
No. Once you have opened an account you cannot make any additional contributions. However, you can close your existing account and open a new account, combining any additional contributions with your existing balance.
Important to know: Government changes to deeming rules could affect you if you choose to close your current account and open a new one. To find out whether your entitlements – including the age pension – could be reduced, we recommend seeking financial advice first.
Your regular pension income payments will be paid directly to a personal or joint bank account nominated by you in your application form. You can choose to receive payments twice monthly, monthly, bimonthly, quarterly, four-monthly, six-monthly or annually.
You have access to make lump sum withdrawals (over and above your pension (income)) payments from a retirement pension however, with a transition to retirement pension lump sum withdrawals are limited and you can only commute your pension by transferring your account balance into an accumulation product.
You need to have met preservation age and have a minimum investment amount of $10,000. Other eligibility conditions apply. Refer to the Vision Super Income Streams PDS for further details.
Eligibility for the government age pension depends on your age, residency status, and the income and assets tests, plus the value of your assets. If you are eligible, for all or part of the government age pension, then combining it with your Vision Super pension can work well. You can use the age pension to meet basic living costs and spending money can come from your Vision Super pension.
When you open your Pension account, you’ll have the option of nominating your spouse as a ‘reversionary beneficiary’. This means that if you die, the account will change ownership to your spouse and regular payments from the account will be paid to the spouse. Your spouse will then have the option of withdrawing the account balance if he/she meets preservation age and other rules. Alternatively, you can nominate one or more binding or preferred non-binding beneficiary (the beneficiary must be your dependant and/or legal personal representative when you die).
How long it will last depends on the amount of money you start with, the rate at which you withdraw income (or lump sums), and other factors such as investment returns and fees. There is no guarantee your Retirement Income Stream will provide an income for the rest of your life and payment will only continue to be made until your account balance is exhausted. Ensuring you plan and budget appropriately may assist with helping your money last. The Retirement income calculator may be able to help see if your super is on track and plan where you would like to be.
Our retire with us section can help you understand the steps you need to take to start planning for your retirement. You can:
You can also enter your current super balance into the Retirement income calculator and receive a projection of the estimated annual retirement income you could receive once you stop working. Try it now to see what you might be able to achieve using a few basic strategies.
This is the age at which you can access your super.
DATE OF BIRTH PRESERVATION AGE
Before 1 July 1960 55
1 July 1960 – 30 June 1961 56
1 July 1961 – 30 June 1962 57
1 July 1962 – 30 June 1963 58
1 July 1963 – 30 June 1964 59
After 30 June 1964 60
Stapling commences on 1 November 2021. From 1 November 2021, employers will need to take new steps to determine the correct super fund for new employees.
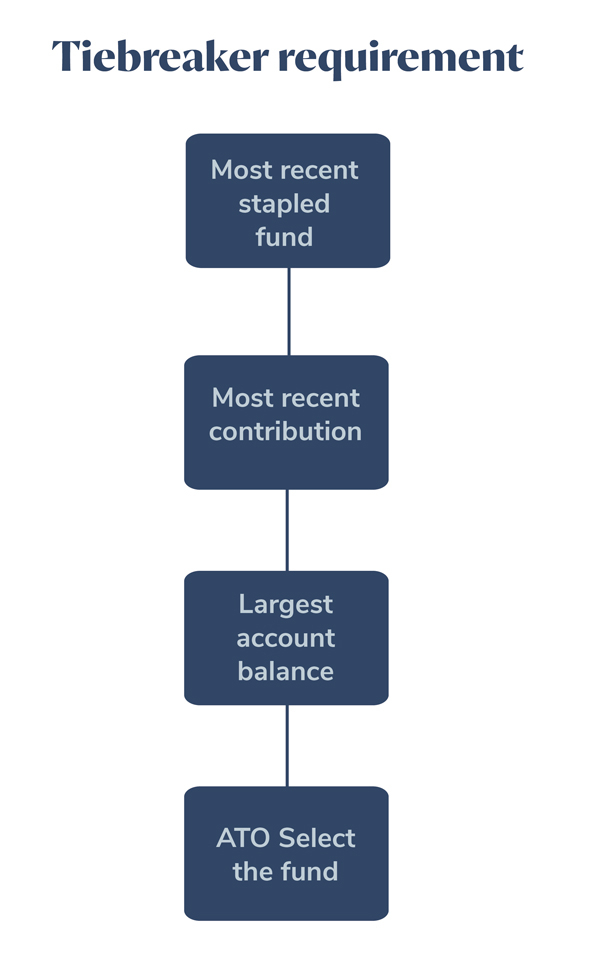
Where the ATO identifies multiple funds that may be stapled to an employee, tiebreaker rules will apply:
If you are doing this for a single member and not using the ATO’s bulk upload service, the ATO expects results to be available within minutes.
If the ATO provides a stapled super fund response to an employer, the ATO will contact the employee and advise them of the request.
Employees will receive an SMS if they have a valid mobile number in the ATO records and/or a letter (through myGov or paper) advising who has requested the information and more details on the options available to the employee.
Yes, it applies to all employers.
Existing employees aren’t affected by these changes. You must continue to make their compulsory superannuation guarantee (SG) payments into the same super fund account you do today.
Yes, you still need a default fund. If a new employee starts on or after 1 November 2021, and neither nominates a fund nor has an existing fund, you will pay their contributions to your default fund.
If an employee doesn’t have a super account –this maybe their first job – and doesn’t nominate one with a Choice of fund form, you must pay their super into your default fund.
Bulk requests are available from the ATO where the request is for over 100 staff. The ATO provides a form where employers need to request stapled super fund details for over 100 new starters at once. Bulk requests will have a service standard of up to 5 business days. The bulk request will need to be in a xls or xlsx file that can be downloaded from the ATO from 1 November 2021.
No, stapling doesn’t override choice of fund. Your employees can nominate their preferred fund at any time using a Choice of fund form. Our choice form can be found on the Vision Super website.
If an employee hands you a completed, signed Choice of fund form, you must pay to their nominated fund.
We’re required to have Target Market Determinations under the Treasury Laws Amendment (Design and Distribution Obligations and Product Intervention Powers) Act 2019.
This is to make sure we’re keeping members at the centre of our approach to the design and distribution of our financial products.
This legislation requires financial services product issuers to design products that are appropriate for the consumers in the target market and consistent with their objectives, financial situation, and needs.
A Target Market Determination is a document which describes who a product is appropriate for (target market), and any conditions around how the product can be distributed to customers.
It also describes the events or circumstances where we may need to review the Target Market Determination for a financial product.
It depends how your details have been changed. The most common request is changing a surname due to marriage, which you can do with a certified copy of your marriage certificate, and a Vision Super “Change of Personal Details form” found here: view form
If you have changed your name another way, we recommend you contact us first on 1300 300 820 so we can outline what documents we need to change your details without issue.
If you want to change your address, you can do this by logging onto the secure member portal online, or calling our Member Services team on 1300 300 820.
You can check your balance 24/7 via Vision Online, our secure member secure site, or via the Vision Super app for mobile devices. You can also contact our Member Services on 1300 300 820 or by emailing us on [email protected]
Here’s how it works. You may be able to receive a tax-free contribution from the Government when you make a non-concessional (after-tax) contribution to your super account. The maximum entitlement that can be received is $500 where your total income is $45,400 or less in the 2024/25 year. This reduces on a sliding scale and cuts out if your total income is above $60,400 in the 2024/25 year.
If you’re contributing by BPAY, it can take Vision Super up to two business days to receive your contribution, then up to three business days to process, although most are done the same day they are received. This will depend upon your financial institution’s processing times.
If you’re contributing by cheque, you will need to allow enough time for your chosen postage method to reach us. Once it has arrived, it can take up to five working days to process.
We can also process contributions by EFT, however, this may take up to three business days.
Our platinum rating from SuperRatings mean we’re in the top 25% of super funds rated by SuperRatings for best value for money superannuation. We’ve been awarded the rating 11 years in a row.
Vision Super members pay an administration fee to cover the administrative and operational costs of the the Fund and Trustee. For more information, please read the relevant guide for fees and costs.
Generally, any before-tax money that you pay into your superannuation fund (for example, your super guarantee payment, or salary sacrifice payments) is taxed at a maximum rate of 15%.
The earnings that your fund makes are also taxed (but not the pension untaxed products). And, when you retire and apply to draw an income from your super fund (an account based pension) this is tax-free if you are over 60 years. For more information, please refer to our additional guide on how super is taxed.
It’s important that you provide your tax file number to your super fund or you could be inadvertently paying too much tax.
By calling 1300 300 820, Vision Super members have access to one-off financial advice about their options and benefits in Vision Super, at no extra cost. This includes insurance options, investment choices, Vision Super products, and other basic information.
We also provide access to in-depth personal advice (not limited to Vision Super) by appointment, to discuss at length different topics super and non-super related depending upon your personal financial needs. This more in-depth personal advice is provided by our employees under an arrangement with Industry Fund Services Pty Ltd (IFS) (AFSL no: 232514), referred to as Vision Super financial planners.
Advice fees apply to personal advice that is not limited to Vision Super (including advice about non-super financial products). Advice about superannuation and retirement products may be deducted directly from your Vision Super accumulation account. Set fees apply each time you are provided with advice about:
Vision Super financial planners don’t receive commissions or bonuses for financial advice and are only paid a salary. Their advice is always in your best interests, and you never need to worry whether they’re recommending a product because they want a commission or they’re trying to earn a bonus. For further information about advice fees, see our Fees and Costs page.


